In today’s online landscape, ensuring uninterrupted user experiences on your is nothing short of a necessity. That’s why you’ve arrived on this page, and rest assured, you’re in the right place. Welcome to the world of digital performance optimization!
We’re here to delve into the fascinating realm of synthetic monitoring. These tools are a powerful ally in your quest for flawless online performance.
The best Synthetic monitoring tools are often hailed as a secret weapon. They play a pivotal role in proactively safeguarding your digital presence. Our journey will unravel the core concepts, benefits, and best practices of synthetic monitoring.
We’ll equip you with the knowledge you need to navigate the digital realm with confidence. We’ll also ensure your users enjoy a seamless online journey. So, say goodbye to blind spots in your online operations. And get ready to elevate your game with the ultimate synthetic monitoring tools guide!
Quick List of Best Synthetic Monitoring Tools
For your convenience, here is a quick overview of all the tools we have ranked on top –
Pingdom – Best for Instant Alerting and Page Speed Analysis in Synthetic Monitoring.
Sematext – Best for Comprehensive Monitoring with Rich Integration Capabilities.
Datadog – Best All-in-One Solution with Traffic Flow Visualization for Cloud Environments.
ManageEngine – Best for SLA Monitoring and Real Browser Testing in Synthetic Monitoring.
New Relic – Best for Detailed Business Insights and Global Performance Monitoring Every Minute.
Comparison Chart Of 5 Top Synthetic Monitoring Tools
Each of these tools has its own set of strengths, making them suitable for different use cases. Depending on specific requirements, one may be a better fit over the others.
Here are the top synthetic monitoring tools –
Here’s a comparison chart –
Tools | Multi-Step Transactions | Global Monitoring | Behind Firewall | API Monitoring | SLA Monitoring | Real User Monitoring | Transaction Recording |
 | Yes | Yes (100+ Locations) | No | Yes | Yes | No | Yes |
 | Yes | Yes (Multiple Locations) | Yes | Yes | Yes | Yes | Yes |
 | Yes | Yes (Global Performance) | Yes (Private Locations) | Yes | Yes | Yes | Yes (Web Recorder) |
 | Yes | Yes (Global Monitoring) | No | No | Yes | Yes | Yes |
 | Yes | Yes (8 Global Locations) | Yes | No | No | Yes | Yes (Web-based Recorder) |
What are the Best Synthetic Monitoring Tools
Synthetic monitoring tools are essential for keeping websites and applications running smoothly. They simulate user interactions to provide detailed performance data, alerting you to any issues.
Pingdom is a leader in this field, offering real-time alerts and an intuitive interface for seamless monitoring. Sematext is another standout, providing a full-stack solution with extensive integrations and the ability to monitor behind firewalls.
Datadog is a top synthetic monitoring tool choice, allowing tests from private and public locations. It also gives a web-based recorder for critical customer journey simulations. ManageEngine excels in SLA monitoring and provides a comprehensive solution for resource monitoring.
New Relic offers AI assistance and a wide range of third-party integrations, delivering detailed business insights in a user-friendly format.
These synthetic monitoring tools open-source or paid, are crucial for businesses looking to deliver top-notch user experiences. And this ensures their online presence remains competitive.
They offer invaluable insights into software testing metrics, allowing for prompt issue resolution and optimization efforts.
How Best Synthetic Monitoring Tools Can Help Your Software Development or Testing
Synthetic monitoring tools play a pivotal role in software development and testing processes. They offer a range of benefits that contribute to the overall success of these endeavors–
Early Benchmarking
Synthetic monitoring allows you to establish performance benchmarks before your website or application is even launched. This provides a baseline for comparison and helps identify areas that may need improvement.
Scaling Capabilities Testing
Before going live, synthetic monitoring helps test the scalability of your system. It ensures that your software can handle a surge in user traffic without experiencing performance bottlenecks.
Proactive Issue Detection
These tools act as an early warning system, alerting you to any performance or availability issues. This allows you to address issues before they impact end-users.
Comprehensive Testing
Synthetic monitoring tools can simulate complex interactions, providing a thorough assessment of critical business transactions. This helps in identifying any potential weaknesses or areas for improvement.
Global Performance Assessment
By testing from multiple locations around the world, these tools provide insights into how your software performs across different regions, network conditions, and devices.
Certificate and Uptime Monitoring
They keep track of SSL certificate expirations and ensure your application is consistently available.
Load Time Analysis
Synthetic monitoring tools measure load times, helping you identify and rectify any performance lags.
Best 5 Synthetic Monitoring Tools
Synthetic monitoring tools are a critical component of any software development or testing process. Here is all about the best ones—
1. Pingdom

Pingdom stands as one of the more popular and versatile synthetic monitoring tools available. It specializes in synthetic and real user monitoring. This makes it an ideal choice for organizations seeking a focused approach to website performance testing.
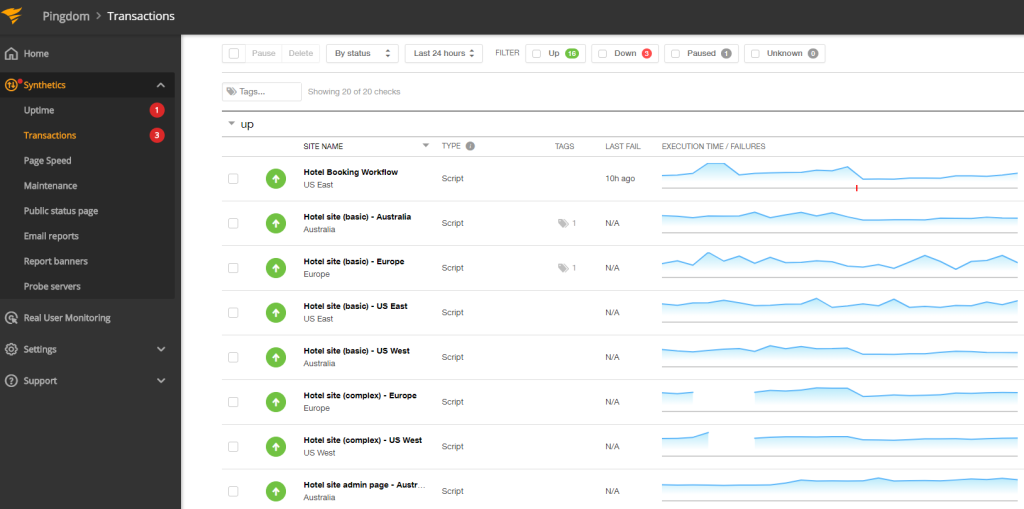
Pingdom excels in its ability to conduct multi-step transactions, though this may require some programming proficiency. It has a vast network of over 100 test locations worldwide. So, it promptly alerts users of system failures via various integrations like Slack, PagerDuty, and more.
Pingdom offers a range of testing frequencies, from every five minutes to 24 hours. This caters to different monitoring needs. Its website transaction monitoring feature simplifies setup.
While the pricing may lean towards the higher end, Pingdom’s emphasis on transaction monitoring and real-time alerts positions it as a robust solution for businesses prioritizing website performance.
About Pingdom
- Founding year: 2005
- Founding team: Sam Nurmi
Key Features
Main features of Pingdom are —
Multi-Step Transactions
Pingdom’s standout feature is its ability to conduct multi-step transactions. This means it can mimic complex user interactions on a website.
It helps identify performance bottlenecks and potential issues in critical workflows. This feature is particularly valuable for e-commerce sites or applications with intricate user journeys.

Wide Network of Test Locations
Pingdom offers a network of over 100 test locations globally. This extensive reach allows for comprehensive monitoring from various regions. Such features provide a holistic view of website performance. It ensures that businesses can gauge how their site performs for users around the world.

Real-Time Alerts
Pingdom excels in providing instant alerts in case of system failures or performance degradation. This ensures that teams can take immediate action to rectify issues, minimizing downtime and ensuring a seamless user experience.
Integration with popular alerting channels like Slack and PagerDuty further enhances its utility.
Pros of using Pingdom
- Instant alerts via Email, Slack, or SMS.
- Offers website transaction recording for easy setup.
- Provides Service Level Agreement (SLA) monitoring.
- Offers a user-friendly interface for quick setup and use.
- Monitors uptime and API performance effectively.
Cons of using Pingdom
- Pricing can be relatively higher compared to some alternatives.
- May require some programming knowledge for complex tests.
- Limited to synthetic and real user monitoring only.
Pricing
- Starts at: $10 per month
- Synthetic Monitoring: $ 120 /yr
- Real User Monitoring: $ 120 /yr
- Yearly Price $ 240 /yr

Customer Ratings
Capterra: 4.5 · 73 reviews
Our Review of Pingdom
As for Pingdom, it stands out for its instant alerting capabilities, ensuring you’re promptly notified of any performance issues. It excels in page speed analysis, providing detailed insights into load times and potential optimizations.
Its user-friendly interface makes setup a breeze, even for those without extensive technical expertise.
However, be aware that it might require some programming knowledge for more complex tests. Overall, Pingdom is a reliable choice for those prioritizing timely alerts and in-depth page speed analysis.
2. Sematext

Sematext has gained favor among DevOps teams for its comprehensive application performance monitoring capabilities. With the addition of synthetic and real user monitoring tools, it has evolved into a full-stack monitoring and observability platform.
Sematext’s synthetic monitoring solution is known as Synthetics. This enables users to monitor APIs and websites globally.
Hence one can assess performance across various devices, browsers, and connection types.
The tool offers a rich library of third-party integrations. It also supports multi-step user journeys with Puppeteer. It even allows monitoring behind the firewall.
Sematext’s competitive pricing structure and pay-as-you-go subscriptions add to its appeal.
Additionally, its user-friendly interface makes setting up testing scenarios a breeze. With Sematext Synthetics, organizations can maintain a close watch on their website’s performance and promptly address any issues.
About Sematext
- Founding year: 2007
- Founding team: Otis Gospodnetić, Rafa Ku
Key Features
Main features of Sematext are –

Multi-Device, Multi-Browser Monitoring
Sematext’s synthetic monitoring solution offers the capability to monitor websites and APIs across multiple devices and browsers.
This ensures that businesses can assess performance comprehensively, accounting for diverse user environments. It’s a crucial feature for ensuring a consistent user experience across various platforms.
Monitoring Behind the Firewall
Sematext goes a step further by allowing monitoring behind the firewall. This means it can assess the performance of resources within a private network.
This would include specific geographical areas that may be more relevant to a business. It offers a flexible approach to testing in different environments.
Rich Library of Integrations
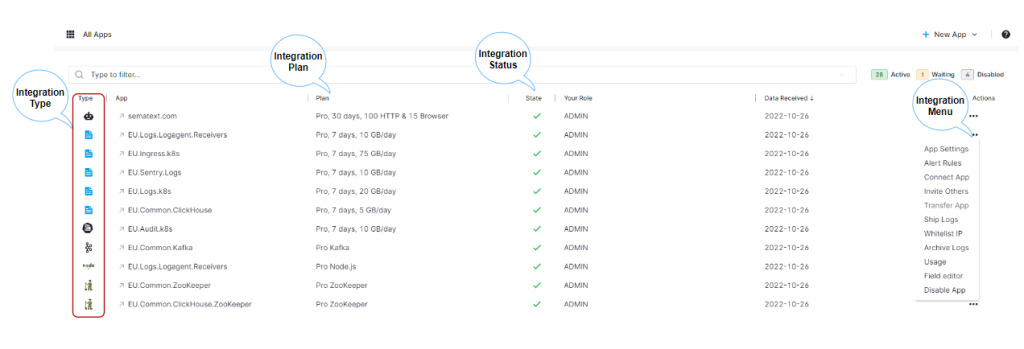
One of Sematext’s strengths is its extensive library of third-party integrations. This means it can seamlessly fit into existing toolchains and workflows. Meaning it enhances its utility for DevOps teams.
Whether it’s integration testing with CI/CD pipelines or other monitoring tools, Sematext ensures a smooth and comprehensive observability experience.
Pros of using Sematext
- Offers a rich library of third-party integrations.
- Allows monitoring behind the firewall.
- Provides logs and infrastructure monitoring alongside synthetic monitoring.
- Supports multi-step user journeys with Puppeteer.
- Competitive pricing with no hidden fees.
Cons of using Sematext
- Lacks a browser extension for recording transactions.
- Requires initial setup and configuration.
Pricing
- Logs: Starts at $50 per month
- Monitoring: Starts at $3.6 per month
- Experience: Starts at $9 per month
- Synthetics: Starts at $2 per monitor

Customer Ratings
G2: 4.7 · 36 reviews
Our Review of Sematext
Sematext is a comprehensive monitoring tool with a robust library of third-party integrations. It goes the extra mile by allowing monitoring behind firewalls, ensuring no aspect of your infrastructure goes unobserved.
The inclusion of logs and infrastructure monitoring alongside synthetic monitoring offers a well-rounded observability solution. One drawback is the absence of a browser extension for recording transactions, which could enhance its usability.
Nevertheless, Sematext’s competitive pricing, transparency, and extensive feature set make it a strong contender for businesses of all sizes.
3. Datadog

Datadog’s Synthetic Monitoring is a comprehensive solution designed to proactively monitor endpoints. It conducts tests from a network of over 200 global locations, providing thorough validation of system layers.
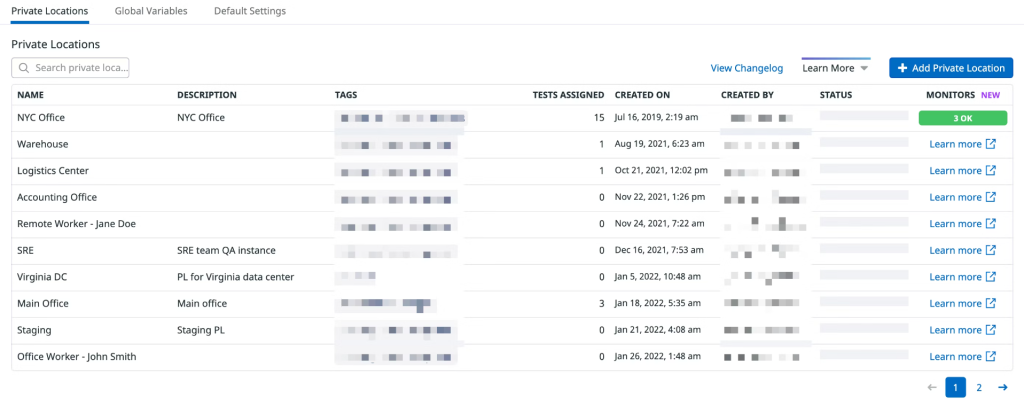
The tool offers flexibility in deployment, allowing tests to be run from both cloud and private locations. This also enables monitoring behind firewalls.
Datadog’s Synthetic Monitoring excels in its ability to compare user experiences from external and internal networks.
While the interface may have a steeper learning curve, Datadog compensates with extensive integration options and full-stack visibility. This makes it a valuable choice for organizations seeking comprehensive synthetic monitoring capabilities.
With features like web recorder, Datadog equips teams with the tools they need to effectively monitor and optimize system performance.
About Datadog
- Founding year: 2010
- Founding team:Olivier Pomel, Alexis Lê-Quôc
Key Features
Primary features of Datadog are–
Full-Stack Visibility
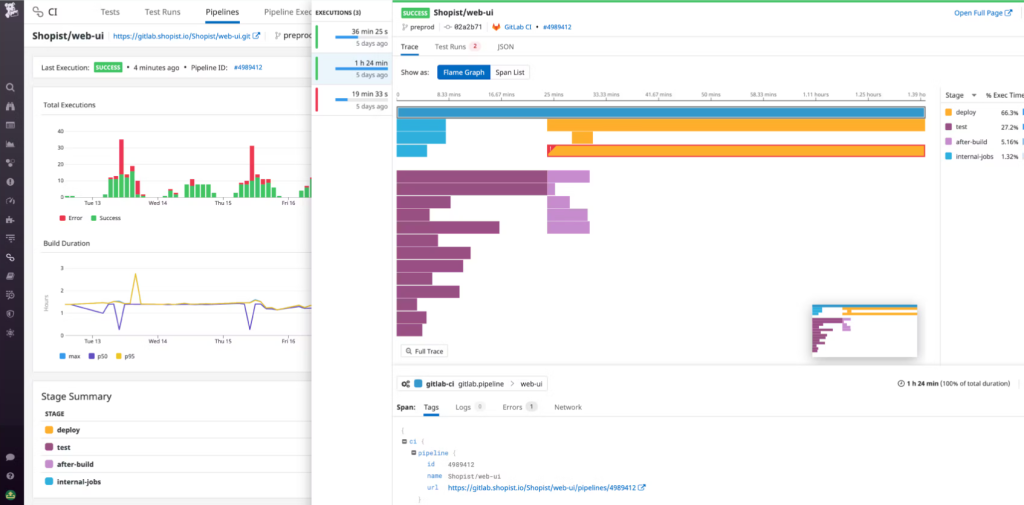
Datadog offers a comprehensive view of your application’s performance, infrastructure monitoring, and synthetic monitoring. This allows you to identify issues from the front-end to the back-end, ensuring a seamless user experience.

Realistic User Scenarios
Datadog’s synthetic monitoring allows you to simulate user interactions. So it provides valuable insights into how your application behaves under different conditions. This feature is crucial for identifying bottlenecks and optimizing critical workflows.
Global Testing Locations
With over 250 testing locations worldwide, Datadog enables you to evaluate your application’s performance from diverse geographic regions. This helps you ensure consistent user experience regardless of the user’s location, improving your global reach.
Pros of using Datadog
- Offers an all-in-one solution covering various monitoring aspects.
- Provides detailed business insights with timeline visualization.
- Features advanced traffic flow visualization for cloud environments.
- Supports executing monitors from private and public locations globally.
- Offers a large library of built-in integrations.
Cons of using Datadog
- Pricing can be on the higher side compared to some competitors.
- Some users may find the dashboard complex to navigate.
Pricing
- Free: $0 upto 5 hosts
- Pro: Starts at $15 per host per month
- Enterprise: Starts at $23 per host per month

Customer Ratings
Capterra: 4.6 · 221 reviews
Our Review of Datadog
Datadog offers an all-encompassing solution with a wide range of features. Its advanced traffic flow visualization is a standout, particularly beneficial for cloud environments.
The tool’s ability to execute monitors from both private and public locations ensures a global perspective on performance.
However, the learning curve for the interface may be steep for some users. Additionally, pricing might be a consideration.
Remember, the extensive feature set and comprehensive monitoring capabilities make Datadog a powerful choice for organizations seeking an integrated approach to monitoring.
4. ManageEngine
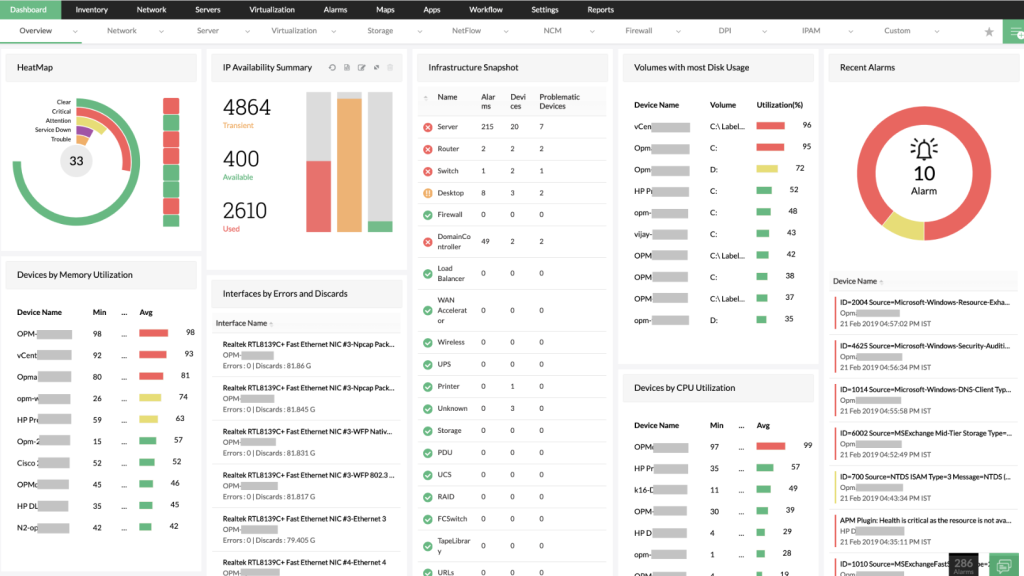
ManageEngine’s Synthetic Monitoring solution stands out for its capability to simulate real user behavior and test critical paths. It covers a wide range of monitoring types including website, transaction, mobile, and HTML code monitoring.
With over 20 different monitor types available, users have flexibility in their testing approaches. ManageEngine’s extensive network of over 210 nodes in more than 80 countries ensures thorough global coverage for monitoring.
ManageEngine provides an in-depth and comprehensive synthetic monitoring experience.
The tool’s focus on simulating real user behavior allows organizations to gain a nuanced understanding of their system’s performance.
This makes it an excellent choice for businesses prioritizing user experience.
About ManageEngine
- Founding year: 2006 (official release)
- Founding team:Sridhar Vembu,
Key Features
Main features of ManageEngine are —

Multi-Step Transaction Monitoring
ManageEngine offers the capability to monitor multi-step transactions. As a result, allowing you to assess the complete user journey on your application.
This feature is crucial for identifying any bottlenecks or issues that users may encounter during complex interactions.

Global Testing Network
They have a network of over 100 testing locations worldwide. So, ManageEngine allows you to evaluate your application’s performance from various geographic regions.
This ensures that you can provide a consistent user experience regardless of the user’s location.
SLA Monitoring
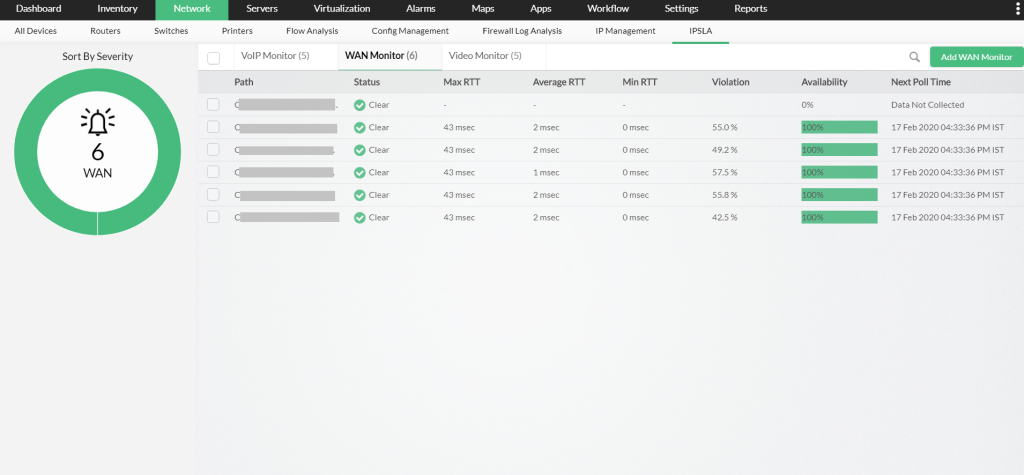
ManageEngine provides Service Level Agreement (SLA) monitoring. This allows you to set performance thresholds and receive alerts when these thresholds are breached.
This feature helps you maintain the agreed-upon level of service quality for your application.
Pros of using ManageEngine
- Specializes in SLA monitoring and real browser testing.
- Offers a global testing network with multiple testing locations.
- Provides detailed reports and snapshots for analysis.
- Allows for precise diagrams for better visualization.
- Can be integrated with other ManageEngine tools for comprehensive monitoring.
Cons of using ManageEngine
- May have a steeper learning curve for less experienced users.
- The interface may not be as intuitive for first-time users.
Pricing
- Professional: Starts at $795 annually
- Enterprise: Starts at $945 annually
- UEM: Starts at $1095 annually
- Security: Starts at $1695 annually

Customer Ratings
Gartner: 4.5 · 188 reviews
Our Review of ManageEngine
ManageEngine impresses with its emphasis on SLA monitoring and real browser testing. The tool’s global testing network and detailed reports provide a comprehensive view of performance.
However, its interface may present a steeper learning curve for those new to the platform. It may require some initial configuration.
The depth of monitoring capabilities and integration options with other ManageEngine tools make it a solid choice for organizations prioritizing SLA adherence and precise performance data
5. New Relic

If you want to try free synthetic monitoring tools, New Relic’s Synthetic Monitoring offers a robust solution with its trial. It provides detailed business insights presented in an easily digestible timeline format.
The web-based recorder allows for the simulation and measurement of critical customer journeys without the need for extensive scripting.
New Relic’s comprehensive monitoring of critical workflows and interactions helps organizations pinpoint errors and debug efficiently.
While the dashboard may be data-intensive, New Relic makes up for it with AI assistance and a rich library of third-party integrations.
These features enhance the tool’s effectiveness as a synthetic monitoring solution. With New Relic, organizations can confidently monitor their performance on a global scale and ensure seamless user experiences.
About New Relic
- Founding year: 2008
- Founding team:Lew Cirne
Key Features
Key features of New Relic are –

Minute-By-Minute Testing
New Relic’s synthetic monitoring tool operates on a minute-by-minute basis, providing real-time insights into system performance. This high-frequency testing ensures that businesses can promptly identify and address any issues that may arise.
JavaScript-Like Scripting
One of New Relic’s standout features is its scripting capability, which resembles JavaScript. This allows for the creation of advanced tests that collect data on performance and record errors.
Developers find this feature invaluable as it accelerates the debugging process and pinpoints the exact location of failures.
Global Monitoring with Private Locations
New Relic offers testing from eight locations worldwide. Additionally, it allows businesses to incorporate their private locations for monitoring.
This means that organizations can assess performance from specific regions or behind their firewall.
Pros of using New Relic
- Offers detailed business insights with easy-to-digest timelines.
- Provides AI assistance for monitoring and troubleshooting.
- Features a rich library of third-party integrations for added functionality.
- Supports monitoring from private and public locations globally.
- Offers advanced features for simulating user interactions.
Cons of using New Relic
- The dashboard can be overwhelming due to the volume of data presented.
- Pricing may be relatively higher compared to some alternatives.
Pricing
- Free: $0 – free first user
- Standard: $10/first user – $99/additional user
- Pro: $349/user (for annual commitments)
- Enterprise: $549/user (for annual commitments)

Customer Ratings
Capterra: 4.5 · 169 reviews
Our Review of New Relic
New Relic shines in providing detailed business insights through easy-to-digest timelines. Its AI assistance adds an extra layer of efficiency to monitoring and troubleshooting.
The tool’s rich library of third-party integrations enhances its functionality. The dashboard may seem overwhelming at first due to the volume of data.
However, New Relic’s advanced features for simulating user interactions and global monitoring capabilities make it a valuable asset.
Getting the Most Out of Best Synthetic Monitoring Tools
To make the best use of these synthetic monitoring tools, follow the these tips and tricks–
- Define Clear Objectives: Clearly outline what you aim to achieve with synthetic monitoring, whether it’s benchmarking, scalability testing, or early issue detection.
- Customize Testing Scenarios: Tailor your monitoring to mimic real-world user interactions specific to your application, ensuring a comprehensive assessment.
- Utilize Multiple Locations: Test from various global locations to evaluate performance under different network conditions, providing a more holistic view.
- Regularly Analyze Reports: Dive into the detailed reports generated by the monitoring tool to identify trends, areas for improvement, and potential issues.
- Leverage Alerting Systems: Set up alerts to receive notifications the moment any performance thresholds are breached, enabling immediate action.
- Integrate with CI/CD: Seamlessly incorporate synthetic monitoring into your best CI/CD tools pipeline for ongoing assessment.
- Benchmark and Optimize: Use the data gathered to benchmark against industry standards and fine-tune your application for optimal performance.
Conclusion
The world of web and application performance demands the best synthetic monitoring tools to ensure seamless user experiences. These tools, like Pingdom, Sematext, Datadog Synthetic, ManageEngine, and New Relic, offer invaluable insights.
Pingdom’s simplicity makes it a great starting point, while Sematext’s comprehensive features and competitive pricing stand out. Datadog Synthetic combines simplicity with power, while ManageEngine offers a robust solution. New Relic’s testing capabilities are noteworthy.
Each tool has its strengths and weaknesses, making it essential to align your choice with your specific needs. By comparing key features and understanding your objectives, you can harness these tools to optimize your software.
In-depth reviews, pros, and cons, and best practices empower you to make informed decisions. Synthetic monitoring is your proactive partner in delivering top-tier performance, ensuring your digital presence excels in a competitive landscape.
FAQs
What is synthetic monitoring?
Synthetic monitoring involves simulating user interactions on a website or application to evaluate its performance and functionality. It helps identify potential issues before real users encounter them.
How does synthetic monitoring differ from real user monitoring (RUM)?
Synthetic monitoring replicates predefined user journeys, providing controlled insights. RUM, on the other hand, captures actual user data, reflecting authentic experiences and behaviors.
Can I rely solely on synthetic monitoring for performance insights?
While synthetic monitoring is valuable for proactive testing, combining it with real user monitoring offers a comprehensive view. This duo provides a holistic perspective on your application’s performance.
- 5 Best DevOps Platform and Their Detailed Guide For 2024 - December 26, 2025
- Top 10 Cross Browser Testing Tools: The Best Choices for 2024 - October 28, 2025
- 5 Best API Testing Tools: Your Ultimate Guide for 2024 - October 26, 2025
